
- セキュリティダッシュボードの更新時期
- 依存関係スキャンにおける偽陰性の低減
- プロジェクトの脆弱性を時系列で表示
- グループの脆弱性を時系列で表示
- グループのプロジェクトセキュリティステータスを見る
- セキュリティセンター
- 関連するトピック
GitLab セキュリティダッシュボードとセキュリティセンター
セキュリティダッシュボードを使うと、セキュリティスキャナによって検出された脆弱性の傾向を見ることができます。これらの傾向は、プロジェクト、グループ、セキュリティセンターで表示されます。
セキュリティダッシュボードを使用するには、以下が必要です:
- プロジェクトに少なくとも 1 つのセキュリティスキャナを設定します。
-
reports構文 を使用するようにジョブを設定します。 - GitLab Runner11.5 以降を使用してください。GitLab.com の共有 Runner を使っている場合は、正しいバージョンを使っています。
- プロジェクトやグループに対して正しいロールを持っていること。
概要については、セキュリティダッシュボードを参照してください。
セキュリティダッシュボードの更新時期
セキュリティダッシュボードには、デフォルトブランチ上で完了した最新のパイプラインのスキャン結果が表示されます。ダッシュボードは、デフォルトブランチで実行された完了済みのパイプラインの結果で更新され、マージされていない他のブランチのパイプラインで発見された脆弱性は含まれません。
デフォルトブランチのパイプラインでゲートデプロイなどの手動ジョブを使用している場合、スキャン結果はジョブが正常に実行された場合にのみ更新されます。手動ジョブが定期的にスキップされる場合は、allow_failure 属性を使用して、ジョブをオプションとして定義する必要があります。
開発頻度の低いプロジェクトであっても)定期的なセキュリティスキャンを確実に実行するためには、スキャン実行ポリシ ーを使用してください。あるいは、スケジュールされたパイプラインを設定することもできます。
依存関係スキャンにおける偽陰性の低減
スケジュールされたパイプラインの依存関係スキャンで偽陰性を減らすには、以下を確実に実行してください:
- プロジェクトにロックファイルを含めること。ロックファイルは、すべての一時的な依存関係を一覧表示し、そのバージョンを追跡します。
- Java プロジェクトはロック・ファイルを持つことができません。
- Python プロジェクトはロックファイルを持つことができますが、GitLab Secure ツールはロックファイルをサポートしていません。
- 継続的デリバリーのためにプロジェクトを設定します。
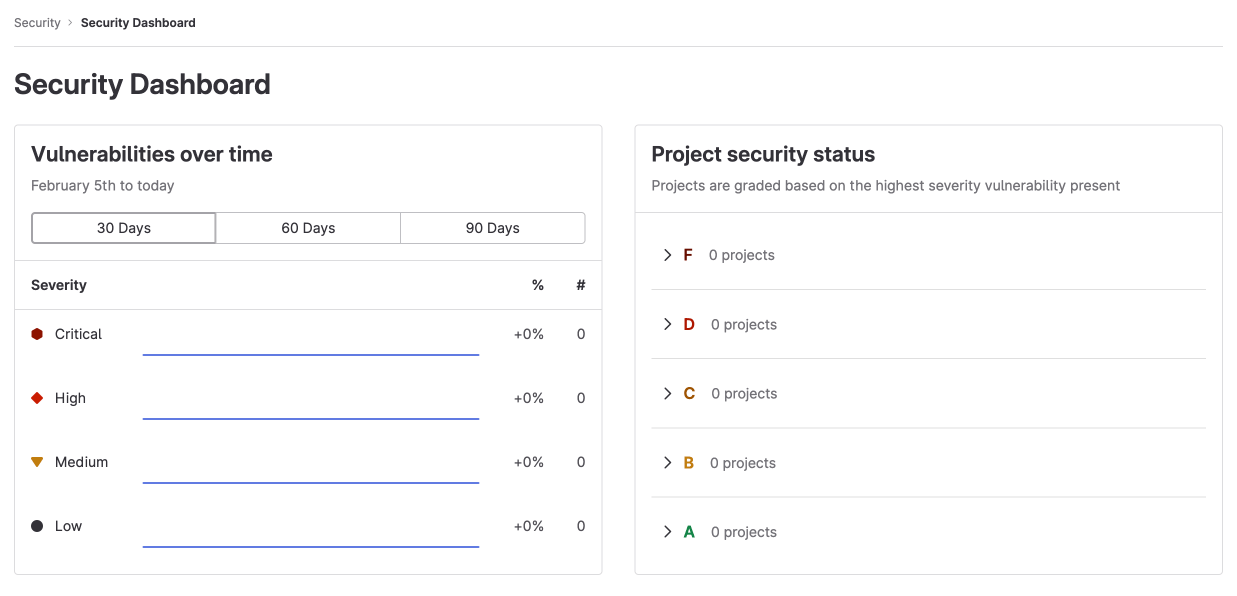
プロジェクトの脆弱性を時系列で表示
プロジェクトセキュリティダッシュボードでは、最大365日間の履歴データを用いて、脆弱性の総数を時系列で表示します。データの更新は、スケジュールされたジョブによって毎日01:15 UTCに開始されます。更新のたびに、オープンな脆弱性のスナップショットが取得されます。データは前の日にバックポートされないため、その日のジョブがすでに実行された後にオープンされた脆弱性は、翌日のリフレッシュジョブまでカウントに反映されません。プロジェクトセキュリティダッシュボードは、現在のステータスがNeeds triage またはConfirmed であるすべての脆弱性の統計情報を表示します。
脆弱性の総数を時系列で表示するには、以下の手順に従います:
- 左のサイドバーで「検索」または「移動」を選択してあなたのプロジェクトを検索します。
- セキュリティ > セキュリティダッシュボードを選択します。
- 必要なものをフィルタリングして検索します。
- 厳しさでChartをフィルタするには、凡例名を選択します。
- 特定の時間枠を表示するには、時間範囲ハンドル({scroll-handle}) を使用します。
- チャートの特定のエリアを表示するには、一番左のアイコン({marquee-selection}) を選択し、チャート全体にドラッグします。
- 元の範囲に戻すには、選択範囲の削除({redo})を選択します。
脆弱性チャートのダウンロード
脆弱性チャートのSVG画像をダウンロードすることができます:
- 左のサイドバーで「検索」または「移動」を選択してあなたのプロジェクトを検索します。
- セキュリティ > セキュリティダッシュボードを選択します。
- チャートを画像として保存({download})を選択します。
グループの脆弱性を時系列で表示
グループセキュリティダッシュボードでは、グループとそのサブグループのプロジェクトのデフォルトブランチで見つかった脆弱性の概要を見ることができます。
グループの脆弱性を時系列で表示するには、以下の手順に従います:
- 左のサイドバーで、Search(検索)を選択するか、Go to(移動)を選択してグループを探します。
- セキュリティ > セキュリティダッシュボードを選択します。
- Chartにカーソルを合わせると、脆弱性の詳細が表示されます。
- 脆弱性のトレンドは、30日、60日、90日の時間枠で表示できます(デフォルトは90日)。
- 90日を超えて集計されたデータを表示するには、VulnerabilitiesCountByDay GraphQL APIを使用してください。GitLabは365日間データを保持します。
グループのプロジェクトセキュリティステータスを見る
プロジェクトのセキュリティステータスを表示するには、グループのセキュリティダッシュボードを使用します。
グループのプロジェクトセキュリティステータスを表示するには
- 左のサイドバーで、Search(検索)を選択するか、Go to(移動)を選択してグループを探します。
- セキュリティ > セキュリティダッシュボードを選択します。
各プロジェクトには、深刻度が最も高い脆弱性に応じてレターグレードが割り当てられます。却下または解決された脆弱性は除外されます。各プロジェクトのレターグレードは 1 つのみで、「プロジェクトセキュリティステータスレポート」に 1 回のみ表示されます。
脆弱性を表示するには、グループの脆弱性レポートに移動します。
プロジェクトの脆弱性等級
| 等級 | 説明 |
|---|---|
| F | 1つ以上のcritical の脆弱性 |
| D | 1つ以上のhigh またはunknown の脆弱性 |
| C | 1つ以上のmedium の脆弱性 |
| B | 1つ以上のlow の脆弱性 |
| A | 脆弱性ゼロ |
セキュリティセンター
GitLab 13.4 で導入されました。
セキュリティセンターは、プロジェクト全体の脆弱性を表示するパーソナルスペースです。プロジェクトのデフォルトブランチに存在する脆弱性を表示します。
セキュリティセンターには以下が含まれます:
- グループのセキュリティダッシュボード。
- 脆弱性レポーター。
- 表示するプロジェクトを設定するエリア。
セキュリティセンターの表示
セキュリティセンターを表示するには
- 左のサイドバーで、Search を選択するか、次のページに進んでください。
- 作品を選択します。
- セキュリティ > セキュリティダッシュボードを選択します。
プロジェクトをセキュリティセンターに追加します。
プロジェクトをセキュリティセンターに追加します:
- 左のサイドバーで、Search を選択するか、次のページに進んでください。
- 作品を選択します。
- セキュリティを拡大します。
- 設定]を選択します。
- Search your projects(プロジェクトの検索)テキストボックスを使用して、プロジェクトを検索・選択します。
- プロジェクトの追加を選択します。
プロジェクトを追加すると、セキュリティダッシュボードと脆弱性レポートに、それらのプロジェクトのデフォルトブランチで見つかった脆弱性が表示されます。
プロジェクトは最大 1,000 個まで追加できますが、脆弱性レポートのプロジェクトフィルタは 100 個に制限されます。